Google Code Jam Archive — Round 3 2013 problems
Overview
A few contestants started this round by quickly solving D-small. Soon after, mozeda took an early lead with the more clasic approach of solving problem A first. The other three problems turned out to be a lot more difficult. It wasn't until almost an hour into the contest when the first correct submission for C-large came in from team5. A few minutes later, Breakun became the first contestant to solve B-large. The first contestant to solve D-large was pieguy at the 1h20m mark.
At that point, it was clear that none of the problems was impossible, and the race was on for the coveted Onsite Finals spots. Eastern Europeans were dominating this round, with 10 of the top 10 spots and just over an hour left to go, when veteran SnapDragon broke into the top 3 with a correct C-large. Gennady.Korotkevich attempted B-large in the last few seconds of the round, but ran out of time. That didn't stop him from winning the round though.
Overall, this ended up being a very difficult round. Each of the top 25 contestants fully solved one problem other than A, but nobody managed to solve three full problems! Congratulations to the finalists. We hope to see you in London.
Problem A. Cheaters Written by Jan Kuipers. Prepared by Wojciech Tyczynski and Jan Kuipers.
Problem B. Rural Planning Written by David Arthur. Prepared by Tomek Czajka, Onufry Wojtaszczyk, and Ahmed Aly.
Problem C. Are We Lost Yet? Written by David Arthur. Prepared by Tomek Czajka and Ahmed Aly.
Problem D. Observation Wheel Written by David Arthur. Prepared by Tomek Kulczyński and Petr Mitrichev.
Contest analysis presented by Topraj Gurung, Onufry Wojtaszczyk, Petr Mitrichev, Denis Savenkov, Matt Fontaine, Nadeem Mohsin, Nicholas Beato, Lianghao Chen, Yijie Wang, and Zhongtian Jiang.
Solutions and other problem preparation by Hackson Leung, Yiming Li, Ian Tullis, Ilya Kornakov, Steve Thomas, Tiancheng Lou, and Adrian Kuegel.
A. Cheaters
Problem
You've been playing roulette for a while in a local casino. Roulette is a simple casino game in which multiple players place bets on one or more numbers between 0 and 36 (inclusive). Next, a wheel is spun in one direction with a ball spinning in the other direction. The roulette wheel contains the same numbers 0 to 36. Some real roulette wheels also have a space labeled 00, but ours does not. Eventually, the ball falls on one of the numbers. If a player placed a bet on that particular number, he receives 36 times his bet (so the profit of that bet is 35 times the bet). All bets placed on other numbers lose.
Unfortunately, luck hasn't been on your side, and you have been losing all night long. At one point, you started to wonder whether the roulette game was fair or not, and after observing the game some more, you noticed a pattern that must be profitable for the casino: the ball always lands on one of the numbers that has the least total money bet on it! If multiple numbers tie for the least total money bet, the ball lands on one of those uniformly at random.
Of course, you'll be notifying the authorities about this foul play, but first you want to win your money back by exploiting your new-found knowledge. To do so, you wait until all other players have placed their bets and then place bets of your own. Unfortunately, you have a limited budget left, so you cannot bet more than that. You are allowed to bet on zero or more different numbers, and each of those bets can be any positive integer amount (perhaps with different amounts for different numbers), so as long as the sum of your bets does not exceed your budget. What is the maximum expected profit you can make?
Input
The first line of input gives the number of cases, T. T test cases follow. Each test case consists of two lines. The first line contains two integers: the budget you still have, B, and the number of numbers other players have placed bets on, N. The second line contains N integers Xi, the total amounts of money bet by other players on each of those different numbers.
Output
For each test case, output one line containing "Case #x: " followed by the maximum expected profit that you make if you place your bets optimally. A profit will be considered correct if it is within an absolute or relative error of 10-6 of the correct answer. See the FAQ for an explanation of what that means, and what formats of floating-point numbers we accept.
Limits
Time limit: 30 seconds per test set.
Memory limit: 1GB.
1 ≤ T ≤ 100.
1 ≤ N ≤ 37.
Small dataset (Test set 1 - Visible)
1 ≤ B, Xi ≤ 1,000.
Large dataset (Test set 2 - Hidden)
1 ≤ B, Xi ≤ 1012.
Sample
3
100 1
10
34 3
5 6 7
34 4
1 1 10 10
Case #1: 0
Case #2: 2
Case #3: 0.9428571429
In example 2, bet 1 on each of the 34 empty numbers for a guaranteed payback of 36, and a profit of 36 - 34 = 2. In example 3, bet 1 on each of the 33 empty numbers, so that you win 36 with probability 33/35. The gives an expected profit of 33/35 * 36 - 33.
B. Rural Planning
Problem
You have recently purchased a nice big farmyard, and you would like to build a fence around it. There are already N fence posts in your farmyard.
You will add lengths of fence in straight lines connecting the fence posts. Unfortunately, for reasons you don't fully understand, your lawyers insist you actually have to use all the fence posts, or things will go bad.
In this problem, the posts will be represented as points in a 2-dimensional plane. You want to build the fence by ordering the posts in some order, and then connecting the first with the second, second with third, and finally the last one with the first. The fence segments you create should be a polygon without self-intersections. That is, at each fence-post there are only two fence segments, and at every other point there is at most one fence segment.
Now that's easy, but you also actually want to preserve the fact your farmyard is big! It's not really fun to wall off most of your farmyard with the fences. So you would like to create the fence in such a way that the enclosed area is more than half of the maximum area you could enclose if you were allowed not to use all the posts.
Input
The first line of the input gives the number of test cases, T. T test cases follow. The first line of each test case contains the number N of posts. The posts are numbered from 0 to N - 1. Each of the next N lines contains two integers Xi and Yi separated by a single space: the coordinates of the i-th post.
Output
For each test case, output one line containing "Case #x: ", where x is the case number (starting from 1), followed by N distinct integers from 0 to N - 1, separated by spaces. They are the numbers of the posts, in either clockwise or counter-clockwise direction, that you will use to build the fence. Note that the first and last posts are connected.
If there are multiple solutions, print any of them.
Limits
Memory limit: 1GB.
The posts will be at N unique points, and will not all lie on the same line.
Small dataset (Test set 1 - Visible)
Time limit: 30 seconds.
1 ≤ T ≤ 100
3 ≤ N ≤ 10
-100 ≤ Xi, Yi ≤ 100
Large dataset (Test set 2 - Hidden)
Time limit: 60 seconds.
1 ≤ T ≤ 30
3 ≤ N ≤ 1000
-50000 ≤ Xi, Yi ≤ 50000
Sample
3
4
1 2
2 0
0 0
1 1
5
0 0
1 1
2 2
0 2
2 0
3
0 0
1 0
0 1
Case #1: 0 1 2 3
Case #2: 0 1 4 2 3
Case #3: 0 2 1
In the first test case, there are three polygons we can construct, and two of them have a large enough area — the ones described by sequences 0 1 2 3 and 0 2 1 3. The polygon described by 0 1 3 2 would be too small. In the second test case, we have make sure the polygon does not intersect itself, so, for instance, 0 1 2 3 4 or 0 1 3 4 2 would be bad. In the third case, any order describes the same triangle and is fine.
C. Are We Lost Yet?
Problem
It is time for the Google Code Jam Finals, and we all want to be there! Unfortunately, a few of us accidentally ended up going to Mountain View instead of the correct location: London, England. But don't worry - we can take the free Google shuttle service from Mountain View to London!
The shuttle service consists of M one-way routes connecting pairs of cities. For every route, you know from which city and to which city it's going, but unfortunately you do not know exactly how long these routes are. Instead, for every route, you only know that its length can be any integer value from ai to bi, inclusive.
I have taken Google shuttles many times before, so I have suggested a path of routes from Mountain View to London. But you worry that my path-finding skills are not as good as yours, and you want to check my work.
Given the path I am suggesting, could it possibly be a shortest path from Mountain View to London? If not, what is the ID of the first shuttle route on my path that is definitely not part of a shortest path (assuming that all previous shuttle routes have been taken according to the path I suggested)?
For example, suppose we have the following list of shuttle routes:
ID | Start City     |  Destination City  |  Shuttle Length
---+----------------+--------------------+----------------
1  | Mountain View  |  London            |  [100, 1000]
2  | Mountain View  |  Paris             |  [500, 5000]
3  | Paris          |  London            |  [400, 600]
4  | Paris          |  Moscow            |  [500, 5000]
5  | Moscow         |  London            |  [1, 10000]
I suggest the path Mountain View -> Paris -> Moscow -> London. The true shortest path might either be the direct route from Mountain View to London, or the path Mountain View -> Paris -> London. This means that the second route on my path (Paris -> Moscow) was the first one that is definitely not part of a shortest path.
Input
The first line of the input gives the number of test cases, T. T test cases follow. Each test begins with a line containing three positive integers N, M, and P. N represents the total number of cities (cities are numbered from 1 to N), M represents the total number of shuttle routes, and P represents the number of shuttle routes on my path from Mountain View (city #1) to London (city #2).
This is followed by M lines, each consisting of four integers, ui, vi, ai, bi. Each line represents the fact that there is a one-way shuttle route from city ui to city vi, and you know that its length can be any integer value from ai to bi, inclusive. The routes are given IDs from 1 to M in the same order of the input.
This is followed by a line consisting of P unique integers in the range from 1 to M. These represent, in order, the shuttle routes I am taking you on. Each one is an ID of a route from the previous list.
Output
For each test case, output one line containing "Case #x: n", where x is the case number (starting from 1) and n is the ID of the first shuttle route in my path that could not possibly be part of the shortest path from Mountain View to London. If there is no such route, print "Looks Good To Me" instead.
Limits
Time limit: 60 seconds per test set.
Memory limit: 1GB.
1 ≤ T ≤ 10.
1 ≤ ui, vi ≤ N.
1 ≤ ai ≤ bi ≤ 1000000.
My path is guaranteed to be a valid path from Mountain View (city #1) to London (city #2).
There might be more than one shuttle route between the same two cities, and there might be a shuttle route going from a city to itself. Also the suggested path might visit the same city more than once, but it will not use the same shuttle route more than once.
Small dataset (Test set 1 - Visible)
2 ≤ N ≤ 20.
1 ≤ M ≤ 20.
1 ≤ P ≤ 10.
Large dataset (Test set 2 - Hidden)
2 ≤ N ≤ 1000.
1 ≤ M ≤ 2000.
1 ≤ P ≤ 500.
Sample
3
4 5 3
1 2 100 1000
1 3 500 5000
3 2 400 600
3 4 500 5000
4 2 1 10000
2 4 5
3 3 2
1 3 1 1
3 2 1 1
1 2 1 2
1 2
5 6 3
1 3 1 1
4 2 1 9
1 4 1 1
3 5 2 2
5 2 2 2
3 4 1 2
1 6 2
Case #1: 4
Case #2: Looks Good To Me
Case #3: 6
D. Observation Wheel
Problem
An observation wheel consists of N passenger gondolas arranged in a circle, which is slowly rotating. Gondolas pass the entrance one by one, and when a gondola passes the entrance, a person may enter that gondola.
In this problem, the gondolas are so small that they can take just one person each, so if the gondola passing by the entrance is already occupied, the person waiting at the entrance will have to wait for the next one to arrive. If that gondola is also occupied, the person will have to wait for the next one after that, and so on, until a free gondola arrives. For simplicity, we will not consider people exiting the gondolas in this problem — let's assume that all people do is enter the gondolas, and then rotate with the wheel for an arbitrarily long time.
We want to make sure people are not disappointed because of long waiting times, and so we have introduced a flexible pricing scheme: when a person approaches the wheel, and the first gondola passing by the entrance is free, she pays N dollars for the ride. If the first gondola is occupied and she has to wait for the second one, she pays N-1 dollars for the ride. If the first two gondolas are occupied and she has to wait for the third one, she pays N-2 dollars for the ride. Generally, if she has to wait for K occupied gondolas to pass by, she pays N-K dollars. In the worst case, when she has to wait for all but one gondola to pass, she will pay just 1 dollar.
Let's assume that people approach our wheel at random moments in time, so for each person approaching the wheel, the first gondola to pass the entrance is picked uniformly and independently. Let's also assume that nobody will come to the wheel while there's already at least one person waiting to enter, so that we don't have to deal with queueing. A person will always take the first free gondola that passes the entrance.
You are given the number of gondolas and which gondolas are already occupied. How much money are we going to make, on average, until all gondolas become occupied?
Input
The first line of the input gives the number of test cases, T. T lines follow. Each line describes one test case and contains only '.' (dot) or 'X' (capital letter X) characters. The number of characters in this line gives you N. The i-th character is 'X' when the i-th gondola is already occupied, and '.' when it's still free. The gondolas are numbered in the order they pass the entrance, so the 1st gondola is followed by the 2nd gondola, and so on, starting over from the beginning after the last gondola passes.
Output
For each test case, output one line containing "Case #x: y", where x is the case number (starting from 1) and y is the average amount of money we will get, in dollars. Answers with absolute or relative error no larger than 10-9 will be accepted. See the FAQ for an explanation of what that means, and what formats of floating-point numbers we accept.
Limits
Memory limit: 1GB.
1 ≤ T ≤ 50.
Small dataset (Test set 1 - Visible)
Time limit: 30 seconds.
1 ≤ N ≤ 20.
Large dataset (Test set 2 - Hidden)
Time limit: 60 seconds.
1 ≤ N ≤ 200.
Sample
5
.X.
X.X.
.XX.
X..XX.
.XX..X
Case #1: 4.66666666666667
Case #2: 6.00000000000000
Case #3: 5.75000000000000
Case #4: 13.4722222222222
Case #5: 13.5277777777778
Notes
Here's how the first example works. There are nine possibilities, each with probability 1/9:
The first person comes. If the next gondola to pass the entrance is:
- The 1st gondola, which is free, the first person enters it and pays 3 dollars. Then, some time later, the second person comes. If the next gondola to pass the entrance is:
- The 1st gondola, which is occupied, and so is the 2nd gondola, the second person has to wait until the 3rd gondola, and thus she pays just 1 dollar before entering it. In total, we've earned 4 dollars.
- The 2nd gondola, which is occupied, the second person has to skip it and enter the 3rd gondola and thus pays 2 dollars. In total, we've earned 5 dollars.
- The 3rd gondola, which is free, so the second person pays 3 dollars. In total, we've earned 6 dollars.
- The 2nd gondola, which is occupied, the first person has to skip it and enter the 3rd gondola, paying 2 dollars. Then, some time later, the second person comes. If the next gondola to pass the entrance is:
- The 1st gondola, which is free, the second person pays 3 dollars. In total, we've earned 5 dollars.
- The 2nd gondola, which is occupied (as is the 3rd gondola), the second person has to wait until the 1st gondola, and thus she pays just 1 dollar before entering it. In total, we've earned 3 dollars.
- The 3rd gondola, which is occupied, the second person has to skip it and enter the 1st gondola and thus pays 2 dollars. In total, we've earned 4 dollars.
- The 3rd gondola, which is free, the first person enters it and pays 3 dollars. Then, some time later, the second person comes. If the next gondola to pass the entrance is:
- The 1st gondola, which is free, the second person pays 3 dollars. In total, we've earned 6 dollars.
- The 2nd gondola, which is occupied (as is the 3rd gondola), the second person has to wait until the 1st gondola, and thus she pays just 1 dollar before entering it. In total, we've earned 4 dollars.
- The 3rd gondola, which is occupied, the second person has to skip it and enter the 1st gondola and thus pays 2 dollars. In total, we've earned 5 dollars.
We have nine possibilities, earning 3 dollars in one of them, 4 dollars in three of them, 5 dollars in three of them, and 6 dollars in two of them. On average, we earn (1*3+3*4+3*5+2*6)/9=42/9=4.6666666666... dollars.
Analysis — A. Cheaters
Background
This problem challenges us with an 'intelligent' roulette game where the ball always lands on one of the numbers that has the least total money bet on it. Armed with this knowledge, we go to calculate the maximum expected profit. We know the current bets (need to be integers) and our budget. We now place bets (also integers) to maximize our expected profit.
Examples and insights
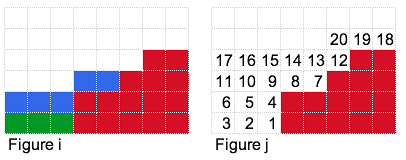
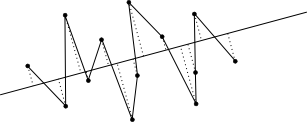
Before we delve into the solution, let's go through a few examples to get an intuition for the solution strategy. First off, we describe the convention used in the figures.
- a square in the figure represents a single unit of money
- a column in the figure represents the current bet (pile of money) on some number
- colors of squares:
- a red square represents the existing bets by other betters
- a white square means there are no bets
- a green square represents the bets we have already placed
- a yellow square represents a bet we are considering
- a blue square represents our bets that we are pointing out
- In our figures, we show only 8 columns (different numbers) even though in our roulette game we have 37 different numbers, we assume all other numbers have much higher bets on them already
- We sort the piles of money (red columns) by increasing height going from left to right
Let's start out with a toy example (see figure a). Here, we have piles of heights 0, 0, 0, 2, 2, 3, 4, 4. Let's say we have 3 units to bet: which piles should we bet on and how much should we bet per pile? In this case, we can bet on the three piles with height 0 (see figure b) which gives us an expected profit of 33.
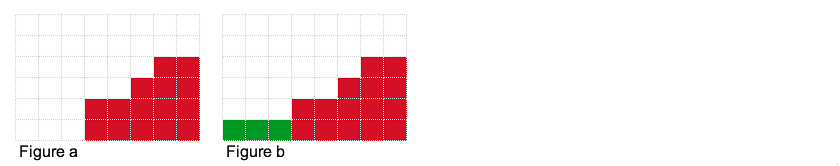
Observation #1: As only the piles with minimum-height have a chance to win, we want to try and place our bets on piles resulting in a minimum-height.
What if we had 6 units to bet? We can again place bets on piles with height 0 (see figure c). The result is 5 piles with height 2 (3 green piles and 2 red piles). Our expected profit is 37.2. By the way, if the red piles of height 2 were instead of height 3, our expected profit would have been 66!
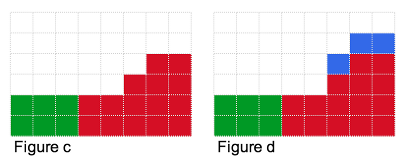
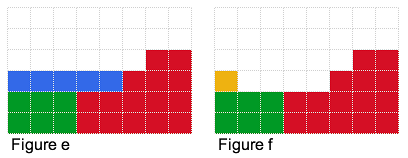
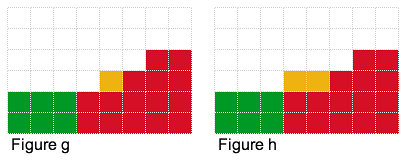
What if we had 7 units to bet? We can place 6 units as described above. But where should we place the 7th one? We could try placing it in the blue locations in figure d, but that does not help at all. Or we could try placing it in any of the blue locations in figure e, which will change our expected profit as it will decrease the total number of piles with minimum-height 2. If we placed the 7th unit in the yellow position as in figure f, we will reduce our expected profit! But if we placed it as in figure g, our expected profit will increase to 47! It increases as we have decreased the number of piles with minimum-height that weren't contributing to our expected profit.
Observation #2: We can possibly increase the expected profit by decreasing the number of piles with minimum-height.
What if we had 8 units to bet? You guessed it. We can place it as in figure h and get an expected profit of 64. In general, our optimal set of bets will have a step like figure of minimum-height h, and height h+1 or higher (as shown by the blue squares in figure i).
Simple strategy
Our simple strategy (for the small input) is to lay the bets one by one as shown in figure j. Each time we put a bet (e.g. in 1), we calculate the expected profit then place the next bet (i.e. 1 and 2) then calculate the expected profit, then repeat for the next one (1, 2 and 3). We retain the maximum expected profit.
This strategy works fine when the bet we have to place is small, but amount of money we can bet can get as large as 1012! Therefore we need to use a strategy that will run faster.
Advanced strategy
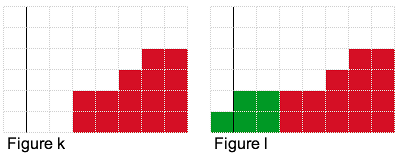
Observation #3: For the optimal solution, the step from minimum-height h to h+1 (or higher) will occur at some vertical location (see figure k). At that vertical location, we want the highest minimum-height h possible with the amount of money we have.
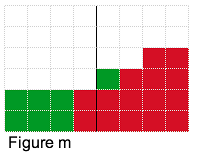
Armed with this observation, we will essentially fix a vertical location and try to build as tall a step as possible. For example if we had 7 units of money and we fixed the vertical step location after the first column as shown in figure k, then the highest step we could build is shown in figure l, which uses 5 units of money (2 units remain unused). For the vertical step location after the fourth block as shown in figure m, we use all 7 units of money.
Therefore the strategy is to try all possible vertical locations, calculate the highest 'step' we can generate for each vertical location and calculate the expected profit. As usual, we retain the maximum one.
So how do we calculate the highest possible step given a vertical location? Doing it by adding squares one-by-one is going to be too slow, therefore we turn to our trusty friend binary search. We want to determine the highest minimum-height step for that vertical location. Notice that since the amount of money (squares) required to build each 'step' is monotonically increasing, we can perform binary search.
Analysis — B. Rural Planning
Introduction
In this problem, we are given a set of points on a 2D plane. The goal is to construct a single simple polygon that uses all of the points. To make things interesting, the area of the resulting polygon has an additional constraint; it must be strictly more than half of the area of the largest polygon constructed from any subset of points. A polygon that takes up maximum area but can use a subset of the points is always the convex hull of the points.
Small
For the small data case, we choose an exhaustive approach that finds the polygon with maximal area. Assuming that it is possible to construct a polygon with a large enough area (see the explanation of the large case for justification), the maximal area polygon will be a solution. The question now becomes how to construct a polygon of largest area. We permute the order of the fence posts. For each ordering, we verify the polygon has no intersecting edges (being careful of edges that pass through fence posts). We keep the polygon with the largest area. With N=10 fence posts, this takes no more than O(N! * T), where T is how long it takes to validate a polygon and compute its area. Verification can be implemented easily in O(N2) time. Polygon area can be done in O(N) time. So the resulting runtime is O(N! * N2). For N=10, this is around 500 million basic operations, which is relatively quick.
Large
For the large case, N = 1000, exhausting even a subset of fence post permutations it too costly. An algorithm over O(N^3) may take too long to compute. We explore a more direct method.
As mentioned earlier, the polygon with the largest possible area using a subset of the fence posts is the convex hull. Suppose we break the convex hull into two polygons, one of these polygons must contain at least half of the convex hull's area. Notice that regardless of how the convex hull is split, one of the resulting polygons is always at least half of the area.
Suppose we have a way to split the convex hull using the interior fence posts. This results in a polygon with at least half of the area of the convex hull, and at least one isolated vertex on the exterior of the polygon. We just need to connect the isolated vertices to the polygon without introducing intersecting edges. This process could only possibly add more area to the polygon, hence the final polygon is strictly more than half of the convex hull's area.
Making the above observation as the basis of our solution, we can arbitrarily split the convex hull into the upper half and lower half.
Note that the union of upper and lower polygon contains the full area of the convex hull. Furthermore the interior path cannot cause intersecting edges, because we chose to sort the points from left to right (note, special care must be taken when ties are involved, see special cases). One of these polygons has at least half the area of the convex hull, as explained above.
As mentioned, the larger of the two polygons will not contain all of the points. However, we can extend the polygon to use all the points. This is done by iteratively adding a point to the polygon. Because all exterior points are on the convex hull, the polygon must increase in area as we do this. The points are added to the polygon by taking an exterior point and "connecting" it to the point left and right of it on the polyline dividing the convex hull. For an optimization, the exterior points can be added at the same time as forming the polyline if you know the exterior points when constructing the polyline.
Special cases
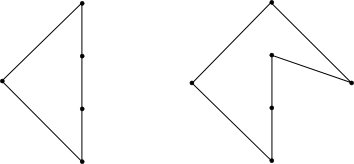
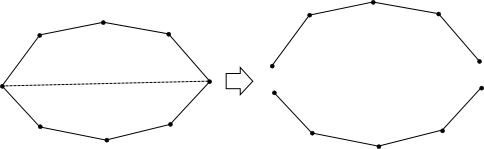
On the left example, the leftmost and rightmost points are connected. In this case, the convex hull is split into the full polygon and a line segment. The full polygon, a.k.a. the convex hull, can simply be used as the final answer.
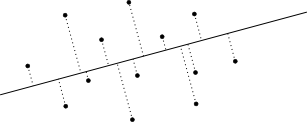
The second special case, above on the right, can occur when points share the same x coordinate and "left to right" is not well defined. An elegant way to handle this case is to project all of the points onto a "nearly horizontal" line and retain the scalar project values. If we pick a line that is not parallel or orthogonal to the line formed by any two points in our input, then each projected point will have a unique position on the "horizontal" line. A line that passes through points (0,0) and (200000,1) will work.
Once all points are projected onto the line, the sort order of the points is determined by the projected value. If we take a collection of points and go through them in this order we form a polyline.
We can show that running this algorithm including the two endpoints of one of our half hulls and all the middle points will create a closed polygon. Notice that when you also expand the middle set to also contain all points that are in the half hulls that the polygon grows in size. This is because the points added are outside our current polygon as a property of the half hull. A line coming from the middle points will move away from the first polygon towards the hull and back to the middle points when following our order. This technique ensures that the area of our polygon grows bigger than the polygon with just the middle points.
Putting it all together
To sum up the solution, we will reiterate the main steps of our algorithm:
- Take the input and turn it into three sets of points cut using line (0,0) to (200000,1):
- upper hull
- lower hull
- middle points
- Run the closing algorithm on using upper hull and combining lower hull and middle points.
- Run the closing algorithm on using lower hull and combining upper hull and middle points.
- Print the solution with the larger polygon.
Analysis — C. Are We Lost Yet?
Introduction
The problem asks you to determine which part of a path E1, E2, ..., Ek can be a prefix of some shortest path from 1 to 2. This would be easy if not for the fact we don't know the exact edge costs - we only know ranges into which they fall.
Small dataset
Let's concentrate on any fixed prefix E1, E2, ..., Ep of the proposed path, and try to make it a prefix of some shortest path. If we decide on a shortest path candidate (that includes our prefix), it's obivously advantageous to assume the edges on our path are as short as possible, and the other edges are as long as possible.
Notice that a consequence of this is that we can just restrict ourselves to looking at graphs in which each of the edges is either as long or as short as possible. Thus, since in the small dataset the number of edges is only 20, we can simply check all possibilities - make some of the edges short, the rest long, find the shortest path in the resulting graph (preferring the proposed path by, for instance, decreasing the cost of the edges on this path by a small epsilon), and then out of all the possibilities pick the one that takes the most steps along the proposed path.
Large dataset
This is obviously not going to fly for the large dataset. Again, we fix a prefix E1, E2, ..., Ep of the proposed path and try to make it a prefix of the shortest path. Assume Ep ends in Tokyo. Thus, we will try to get from Tokyo to London as fast as possible, while still not allowing for a shorter path from Mountain View to London that doesn't begin with our prefix. If we want to optimize for speed, we can do a binary search for the longest prefix that can be a start of some shortest path; if we optimize for simplicity, we can just iterate over all prefixes.
Imagine two robots that try to reach London as fast as possible. One starts from Tokyo, and has a handicap of the cost to travel from the Mountain View to Tokyo along the proposed path (we call this the "good" robot). When this robot goes across an edge, it will always take the minimal cost - this robot represents the shortest path we hope to construct. The other robot starts from Mountain View, and tries to reach London via some other path. We call this the "bad" robot and will try to force it to take as long as possible. The question is whether we can make the good robot be at least as fast as the bad robot (the bad robot can obviously be equally fast simply by following the good robot).
We already set the costs for the edges E1 to Ep to the low values. Since our aim is to make the good robot move fast and the bad robot move slow, a naive approach is to simply have the good robot pay the low cost for all other edges, and the bad robot pay the high cost. However, we will still encounter a problem in this model. If two robots go across a same edge, they are actually taking different costs, which is not possible in a fixed configuration.
Notice, however, that the two robots are walking the same graph. Thus, if they reach a same node at a different time, the one that arrived earlier will always beat the other one if the shortest path goes through that node, because it can always follow the other one's route. This means the later robot does not have any purpose in visiting this node at all. Since ties are resolved in favor of the good robot, we can simply decrease the good robot's handicap by 0.5 to avoid any ties.
Thus, we can solve the problem with a single run of Dijkstra's algorithm. We begin with two starting points - one in Mountain View at time 0, and the other in Tokyo with time equal to the cost of travel along the proposed path to Tokyo minus 0.5. When processing a node, we calculate the costs of outgoing edges as follows:
- If the edge is one of E1, ..., Ep, we take the low cost.
- If the current node is processed because the good robot reached it (which we know because the cost of the current node is not an integer, it ends with 0.5), the cost is the low cost.
- Otherwise, we are processing the node because the bad robot reached it, and the cost is the high cost.
As Dijkstra's algorithm visits a node only once to process outgoing edges, we will never have a robot visit a node that the other robot reached earlier.
Analysis — D. Observation Wheel
Small dataset
In this problem we are interested in calculating the average amount of money we will make from filling up every gondola on our observation wheel. Because of linearity of expectation, this is equivalent to summing up the expected amount of money paid by each person. Given the fact that the amount a person pays doesn't depend on the order in which gondolas got occupied, we can represent the current free/occupied state of gondolas as a bitmask and use dynamic programming to solve the small case.
Let E(mask) be the expected amount of money we make starting from the configuration represented by mask, where 0 represents an empty gondola, and 1 represents an occupied gondola. A person has a probability of 1/N of starting at any given position. Once that starting position is fixed, we simply find the first 0 following it (in cyclic order), and that's where the person will eventually end up.
We'll define f(i) as the index of the gondola occupied by a person who starts at position i. Similarly, let c(i) be the amount of money this person pays, as per the problem statement. Then we have the following recurrence:
E(mask)=1/N*∑i=0..N-1(E(mask | (1 << f(i)) ) + c(i))
The bitwise operation here simply sets the bit corresponding to the gondola the user occupied. The base case is when there are no empty positions, in which case the expected amount of money is 0.
There are 2N states, each of which can be computed in linear time, so our time complexity is O(N*2N). This is pretty easy for the small data set, but unfortunately it's far too slow for the large case.
Large dataset
Let's analyze the problem from the end: one of our gondolas will be the last to become occupied, so we have several cases, one per each free gondola at the beginning. The expected amount of money we will get is equal to the sum of the expected amount of money we make in each of those cases multiplied by the probability of that case.
At first, it doesn't seem we've reduced the complexity of the problem: instead of having to find just the expected amount for the whole process, we now have to find both the expected amount and the probability for several cases! However, we can repeat the above trick. Take one of those cases, let's say that gondola i is the last to become occupied. Let's look at which gondola will be occupied directly before it. Let's say it's gondola j. And here's the breakthrough: as soon as we've fixed that gondolas i and j are the last two to become occupied, the observation wheel has been separated into two independent parts that don't affect each other: those between i and j, and those between j and i. They don't affect each other since i and j stay empty, and thus no person approaching one part of the wheel will end up in the other part.
Our approach in general will be to compute E(i, j), the expected amount of money we get from all gondolas from i-th until (j-1)-th, excluding j-th gondola itself which will stay empty. It is possible to have i > j since we're dealing with a cyclic problem, so keep this in mind when implementing things. We basically start at i and proceed around the circle, stopping just short of j.
To compute expectations, we're going to need probabilities, so first let's look at P(i, j), the probability that j-th gondola will stay empty while we fill up all gondolas from the interval [i, j) assuming each coming person approaches some gondola in inteval [i, j] (note that j is included here). We can develop a recurrence to compute this.
Suppose we know that the last person enters the gondola at position (i + k). This splits the interval into two parts, with a empty squares on the left, b empty squares on the right, and 1 more empty square at (i+k).
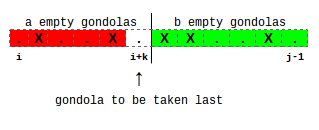
The probability that gondola j stays empty while we fill interval [i, j) and that gondola at position (i+k) is filled last is P(i, j, k) and can be computed as:
P(i, j, k) = C(a+b, a)*((k+1)/(j-i+1))a+1*((j-i-k)/(j-i+1))b*P(i, i+k)*P(i+k+1, j)
Here C(n, k) is the binomial coefficient representing the number of ways to choose k objects from a set of n. The equation above amounts to choosing a people from (a+b) to go on the left side of the final empty space, and then making sure that (a+1) people go to the left side (including the person to fill up gondola i+k) and b people go to the right side. The probability that gondola i+k will stay empty is P(i, i+k), and the probability that gondola j will stay empty is P(i+k+1, j).
This assumes that (i+k) is empty initially, otherwise we define P(i, j, k) = 0.
Of course, we can't actually fix the final person, but since every way to fill up the interval has some final person, we can just compute the probability that gondola j will stay empty as the sum of P(i, j, k) over all possible final positions k, giving:
P(i, j)=∑k=0..j-i-1P(i, j, k)
For our base case, we have P(i, j, k) = 1 if the interval [i, j) contains no free gondolas. This also includes the case where the interval is of size 0. Don't forget, we're still in a cyclic situation!
On to computing expectations! We'll use the same trick of splitting around the last person. The expected money we get while filling out the interval [i, j) so that the last filled gondola is at position (i+k) is:
E(i, j, k) = E(i, i+k) + E(i+k+1, j) + N - k/2
Summing over all possible k to get the expectation, we get:
E(i, j)=(∑k=0..j-i-1P(i, j, k)*E(i, j, k))/P(i, j)
The way the first equation works is to combine the expectations from the left interval and the right interval, and then we need the expected number of skips to place the final person. There are (k+1) starting positions, corresponding to 0 skips, 1 skip, …, k skips. Each of these is equally likely, so the expectation is N - 1/(k+1)*(0 + 1 + ... + k)=N - k/2.
As before E(i, j, k) = 0 if gondola at position (i+k) is occupied.
To compute the final answer, we'll repeat the same trick in the final step. We try all possible empty positions as the last gondola to be filled and compute the expected number of skips. If the last empty position is i, then the expected money we get is:
P(i+1, i)*(E(i+1, i) + (N+1)/2),
and the total expected amount of money is just the sum of this quantity over all empty positions.
This algorithm is O(N3), which is easily within the time limit for the large case.