Google Code Jam Archive — World Finals 2008 problems
Overview
A feast of square boards
We present five problems we like very much for the Google Code Jam 2008 world final. Not until the committee selected all the problems did we find out that the rectangular board of unit squares clearly appears in four of the five problems. Only the first problem is an exception. Does that make the contest imperfect in a perfectionist's eyes? Not at all! See the picture in our analysis for that problem.
Yet that is just a nice coincidence. Each of the five problems have its distinct nature under the cover of these beautiful rectangular grids.
Behind the scenes
Our last problem is called The Year of Code Jam. So is that another nice coincidence? Maybe.
The original author certainly made the name and the good story intentionally. However, the author did not realize a crucial trick. As a result, two easier version of this problem were created, none exciting enough to be selected as the last problem for the final round. Until one day Tomek Czajka looked at them and said, "We just need to change it slightly to be a bipartite graph, and here is a nice trick one can use..."
A bigger story was centered around the problem Bridge Builders. Why is it "bigger"? Because (1) it was the first problem the committee selected for the final round, months before the competition, with all the members voting for it. And (2) up until the day before the final round, it was still unclear whether we would use the problem, with debates raging and whiteboards covered in faulty proofs.
So the story goes like this. Yes, the committee liked it very much. One needs good intuition to see that this is a cute version of minimum weighted spanning tree problem. The committee saw that, and proved it, and the problem was sitting there for months.
Months later, a week before the contest, it was time to finalize the problems. The committee found out that the proof was incomplete. It did not look too difficult to fix, but the task turned out to be tricky. As long as the algorithm was correct, we valued the intuition required to come up with the solution. After a series of debates, discussions, refutations, and verifications, we finally got a proof one day before the contest. The proof was mainly due to Derek Kisman and Christopher Hendrie.
At the world finals
11,000 of you competed in the first round of Google Code Jam 2008, and on Friday morning the top 100 went head-to-head in Mountain View to vie for the top spot. After 3 hours of grueling competition and a problem set that could make your head spin, we had a winner: ACRush of China, jumping into first place with 6 minutes, 40 seconds to go. Innovative.Cat of China came in second, finishing the same set of problems with 5 minutes, 44 seconds left. And a mere 2 points behind them, the difference between two larges, was bmerry of South Africa; he burned through most of the problem set with 1/3 of the contest to go, but couldn't quite finish it off. Everyone solved our easiest problem, and six people solved the hardest one (which was six more than many of us expected!)
Congratulations to all of Friday's contestants, and to everyone who competed in GCJ 2008!
Credits
Problem A. Juice Written by John Dethridge. Prepared by Marius Andrei.
Problem B. Ping Pong Balls Written by William Rucklidge. Prepared by Matthew Chan and Daniel Rocha.
Problem C. Mine Layer Written by Zhen Wang. Prepared by Xiaomin Chen.
Problem D. Bridge Builders Written by Mark Gordon. Prepared by the Code Jam team.
Problem E. The Year of Code Jam Written by Tomek Czajka and Xiaomin Chen. Prepared by Bartholomew Furrow and Xiaomin Chen.
Contest analysis presented by Xiaomin Chen and Derek Kisman.
A. Juice
Problem
You are holding a party. In preparation, you are making a drink by mixing together three different types of fruit juice: Apple, Banana, and Carrot. Let's name the juices A, B and C.
You want to decide what fraction of the drink should be made from each type of juice, in such a way that the maximum possible number of people attending the party like it.
Each person has a minimum fraction of each of the 3 juices they would like to have in the drink. They will only like the drink if the fraction of each of the 3 juices in the drink is greater or equal to their minimum fraction for that juice.
Determine the maximum number of people that you can satisfy.
Input
- One line containing an integer T, the number of test cases in the input file.
For each test case, there will be:
- One line containing the integer N, the number of people going to the party.
- N lines, one for each person, each containing three space-separated numbers "A B C", indicating the minimum fraction of each juice that would like in the drink. A, B and C are integers between 0 and 10000 inclusive, indicating the fraction in parts-per-ten-thousand. A + B + C ≤ 10000.
Output
- T lines, one for each test case in the order they occur in the input file, each containing the string "Case #X: Y" where X is the number of the test case, starting from 1, and Y is the maximum number of people who will like your drink.
Limits
Time limit: 30 seconds per test set.
Memory limit: 1GB.
1 ≤ T ≤ 12
Small dataset (Test set 1 - Visible)
1 ≤ N ≤ 10
Large dataset (Test set 2 - Hidden)
1 ≤ N ≤ 5000
Sample
3
3
10000 0 0
0 10000 0
0 0 10000
3
5000 0 0
0 2000 0
0 0 4000
5
0 1250 0
3000 0 3000
1000 1000 1000
2000 1000 2000
1000 3000 2000
Case #1: 1
Case #2: 2
Case #3: 5
In the first case, for each juice, we have one person that wants the drink to be made entirely out of that juice! Clearly we can only satisfy one of them.
In the second case, we can satisfy any two of the three preferences.
In the third case, all five people will like the drink if we make it using equal thirds of each juice.
B. Ping Pong Balls
Problem
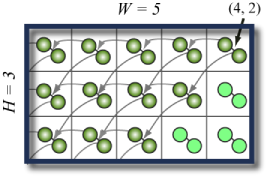
A large room is filled with mousetraps, arranged in a grid. Each mousetrap is loaded with two ping-pong balls, carefully placed so that when the mousetrap goes off they will be flung, land on other mousetraps and set them off. The walls of the room are sticky, so any balls that hit the walls of the room are effectively absorbed.
Every mousetrap that gets hit sends the two ping-pong balls in the same way: their movement is determined by a X and Y displacement relative to the launching mousetrap. You then decide to launch a single ping-pong ball into the room. It hits a mousetrap, setting it off, and launching its two balls. These two balls then set off two more mousetraps, and now four balls fly off... When the dust settles, many of the mousetraps have been set off, but some have been missed by all the flying balls.
You need to calculate how many mousetraps will be set off.
As an example (see the first sample test case), the picture below illustrates a room with width 5, height 3. The two directions for the ping-pong balls in each room are (-1, 0) and (-1, -1), respectively. The first ball you launch hits the mousetrap at the position (4, 2). In the end, 12 mousetraps are triggered.
Input
The first line of input gives the number of cases, C. C test
cases follow. Each case contains four lines. The first line is the size of the
grid of mousetraps (equal to the size of the room), given as its width
W and height H. The next two lines give the destinations of the
two ping-pong balls, as an X and Y displacement. For example, if the two lines
were 0 1 and 1 1, then triggering a mousetrap would
launch two balls; one would hit the mousetrap just up from the triggered
mousetrap, and the other would hit the mousetrap that is up and to the right
of the triggered mousetrap. The final line has two integers specifying,
respectively, the column and row of the mousetrap set off by the original
ping-pong ball (where 0 0 would be the bottom left mousetrap).
Output
For each test case, output one line containing "Case #A: B", where A is 1-based number of the case and B is the number of mousetraps that are triggered (including the first one).
Limits
Time limit: 30 seconds per test set.
Memory limit: 1GB.
1 ≤ C ≤ 100
-20 ≤ any displacement ≤ 20
Neither vector will have zero length.
Small dataset (Test set 1 - Visible)
2 ≤ W, H ≤ 100
Large dataset (Test set 2 - Hidden)
2 ≤ W, H ≤ 1000000
Sample
3
5 3
-1 0
-1 -1
4 2
50 50
0 1
1 1
10 10
6 2
2 0
3 0
0 0
Case #1: 12
Case #2: 820
Case #3: 5
C. Mine Layer
Problem
MineLayer is a MineSweeper-like puzzle game played on an R by C grid. Each square in the grid either has one mine or no mines at all. A MineLayer puzzle consists of a grid of numbers, each of which indicates the total number of mines in all adjacent squares and in the square underneath. The numbers will thus range from zero to nine.
The objective of MineLayer is to figure out a layout of the mines in the grid that matches the given clues.
Below is a typical 3 by 4 grid. The original layout is on the left, and the puzzle on the right.
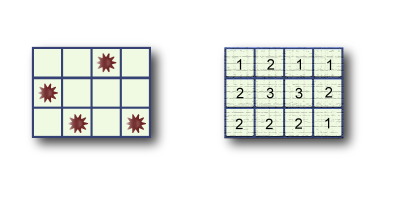
Since there may be many solutions, your task is to write a program that outputs the maximum possible number of mines in the middle row. The number of rows will always be odd, and there will always be at least one solution to the puzzle.
Input
The first line of input gives the number of cases, N. N test cases follow.
The first line of each case contains two space-separated numbers: R, the number of rows, and C, the number of columns. R is always an odd integer. Each of the next R lines contains C space-separated numbers that denote the clues of that row.
Output
For each test case, output one line containing "Case #X: Y", where X is the 1-based case number, and Y is the maximum possible number of mines in the middle row of a grid that satisfies the given constraints.
Limits
Time limit: 30 seconds per test set.
Memory limit: 1GB.
1 ≤ N ≤ 50.
Each puzzle is guaranteed to have at least one solution.
Small dataset (Test set 1 - Visible)
R = 3 or R = 5.
3 ≤ C ≤ 5.
Large dataset (Test set 2 - Hidden)
R is an odd number between 3 and 49, inclusive.
3 ≤ C ≤ 49.
Sample
2
3 3
2 2 1
3 4 3
2 3 2
3 4
1 2 1 1
2 3 3 2
2 2 2 1
Case #1: 1
Case #2: 1
D. Bridge Builders
Problem
The king wants bridges built and he wants them built as quickly as possible. The king owns an N by M grid of land with each cell separated from its adjacent cells by a river running between them and he wants you to figure out how many man-hours of work it will take to build enough bridges to connect every island. Some cells are actually lakes and need not have a bridge built to them.
Some of the islands are forests where trees are abundant. Located in the top left corner is the base camp, which is always a forest.
A bridge can only be built between two islands if they are vertically or horizontally adjacent, and one of the islands is accessible from the base camp through the bridges that are already built.
The number of man-hours it takes to build a bridge is the number of bridges the builders have to cross to get from the nearest forest to the island you're building to, including the bridge being built. Builders can only walk between two islands if there is already a bridge between them.
The king has already ensured that there is at least one way to connect all the islands.
Write a program that, given a map of the islands, will output the minimum number of man-hours required to connect all islands.
Consider this example. A green tile indicates a forest, gray indicates an empty island, and blue indicates water.

One optimal solution starts out by building the following bridges from the base camp forest.

This has a cost of 1 + 2 + 1 + 2 + 3 + 4 = 13
Now since the forest at row 3, column 3 is connected to base camp, we can build bridges from there. One optimal solution connects the rest of the islands with bridges built from this forest.

This has a cost of 2 + 1 + 2 + 1 + 2 + 3 = 11. This brings the total cost to 24 which is the optimal solution.
Input
The first line of the input contains an integer T, the number of test cases. T test cases follow. Each test case will begin with N, the number of rows, and M, the number of columns, on one line separated by a space. N rows follow that contain exactly M characters each. A 'T' indicates an island with a forest, a '#' indicates an island, and a '.' indicates water.
Output
A single line containing "Case #X: Y", where X is the 1-based case number, and Y is the minimum number of man-hours needed to connect all islands.
Limits
Time limit: 30 seconds per test set.
Memory limit: 1GB.
1 ≤ T ≤ 50
2 ≤ N ≤ 30
2 ≤ M ≤ 30
The top left cell will always be a 'T'
It will be possible to connect all islands through bridges
Small dataset (Test set 1 - Visible)
There will be at most 2 forests in the grid including the base camp.
Large dataset (Test set 2 - Hidden)
There will be no limit on the number of forests in the grid.
Sample
3
2 2
T.
T#
4 4
T##.
##.#
.#T#
####
5 5
T#T.#
..#.#
#.###
###.#
T###T
Case #1: 2
Case #2: 24
Case #3: 49
E. The Year of Code Jam
Problem
The year 2008 will be known as a year of change and transition, the start of a
new era: we're talking, of course, about the new Google Code Jam format. The
introduction of this contest has jammed so many great programming competitions
together in a single year that people have started calling it
The Year of Code Jam.
Sphinny, a passionate contestant, is looking at her calendar of the year and
discovering that a great number of programming contests has been scheduled.
She has marked every day of the year on the calendar in one of the three ways:
- White: She will not participate in a contest on this day. Either no contests are scheduled, or she has more important things to do (surely there are other good things in life!).
- Blue: She will definitely participate in a contest on this day.
- Question mark: There is a contest scheduled, but she has not decided yet whether she will participate.
Note: To simplify the problem, we'll assume that there is no concept of qualification: you don't have to participate in one contest to be eligible for another.
Being in a world that is somewhat different from ours, Sphinny's calendar has some features we must mention: It has N months, and each month has exactly M days.
The picture below depicts a calendar with 5 months, 8 days in each month, 15 blue days, and 5 question marks.
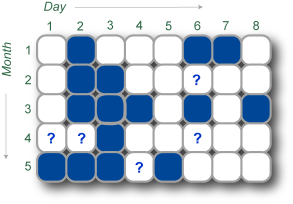
Looking at her beautiful calendar, Sphinny has decided that each day has up to 4 neighbors in the year: The previous day in the same month, the next day in the same month, the same day in the previous month, and the same day in the next month.
Sphinny wants to maximize her happiness from these contests, and she estimates the effect of the contests on her happiness as a summation of values for all the blue days. For each blue day, the value is computed as follows:
- The initial value is 4.
- For each blue neighbour the day has, decrease the value by 1.
You may think that Sphinny likes the contests, but participating on two consecutive days makes her a little tired. And for aesthetic reasons, participating on the same day in two consecutive months is also not so great.
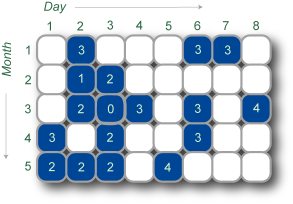
Sphinny wants to plan her year now, and decide for every day with a question mark whether it should be white or blue. Her goal is simply to maximize the happiness value.
The following picture shows a solution for the example above. By changing two question marks to blue days, and the other three to white days, she can achieve a happiness value of 42.
Input
The first line in the input file contains the number of cases T. This
is followed by T cases in the following format.
The first line is of the form "N M", where N and M are
two numbers giving the number of months and the number of days per month.
The next N lines each contain a string of length M. The
j-th character in the i-th string is one of {'#', '.', '?'},
which gives the status of the j-th day in the i-th month. '#' indicates a blue
day, '.' indicates a white day, and '?' indicates a day with a question mark.
Output
For each input case, you should output a line in the format:
Case #X: Y
where X is the 1-based case number, and Y is the maximum happiness value.
Limits
Memory limit: 1GB.
1 ≤ T ≤ 100.
Small dataset (Test set 1 - Visible)
Time limit: 30 seconds.
1 ≤ M, N ≤ 15.
Large dataset (Test set 2 - Hidden)
Time limit: 120 seconds.
1 ≤ M, N ≤ 50.
Sample
2
3 3
.?.
.?.
.#.
5 8
.#...##.
.##..?..
.###.#.#
??#..?..
###?#...
Case #1: 8
Case #2: 42
Note that the second sample is our example in the pictures above.
Analysis — A. Juice
In this problem, we need to find the best (A*, B*, C*) such that there is a maximum number of (A, B, C) triplets in the input satisfying:
A ≤ A*, B ≤ B*, C ≤ C*, and A* + B* + C* ≤ 10000.
It is easy to see that we can just consider integer A*, B*, C*'s. In fact C* can be one of the C's from the input, so are A* and B* -- otherwise we can just decrease it until it hits some C for a satisfied customer.
So we have at most 5000 possible candidate values for C* (or 10000, if you don't want to use the above observation). We try each of them. And the problem is nicely visualized in 2-dimensional grid.
For a fixed C*, we know A* + B* ≤ 10000 - C*. We filter out all the inputs that have
C ≤ C* or A + B ≥ 10000 - C*,
and view the remaining as points in the 2-d plane, with their A, B as the coordinates. For the best solution (A*, B*), we can just try all the integer points (10001 - C* of them) on the line A* + B* = 10000 - C*. For each point, we need to know quickly how many input points are dominated by that point, i.e., lying in the axis-parallel rectangle between the origin and that point.
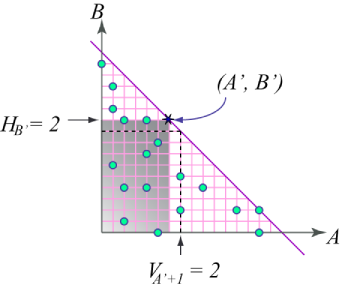
The last step must be computed fast enough to meet the time limit of the competition. Assume we move the point (A*, B*) from the top-left to bottom-right. In a certain step, we are at (A', B'), with Q points dominated by it. In the next step, we are at (A' + 1, B' - 1), the number of points dominated by the new point can be computed as
Q' = Q - HB' + VA' + 1,
where VA is the counter of points on the A-th vertical line, and HB is the number of points on the B-th horizontal line. Q' can be computed in constant time if we pre-compute the counters.
Solution from the judges:
int T, n, ans;
int A[5000], B[5000], C[5000], H[10001], V[10001];

int main() {
  cin>>T;
  for (int t=1; t<=T; t++) {
    cin>>n;
    for(int i=0; i<n; ++i) cin>>A[i]>>B[i]>>C[i];

    int ans = 0;
    for (int CC=0; CC<=10000; ++CC) {
      memset(H, 0, sizeof(H));
      memset(V, 0, sizeof(V));
      for (int i=0; i<n; ++i)
        if (C[i]<=CC && A[i]+B[i]+CC<=10000)
        { V[A[i]]++; H[B[i]]++; }
      int Q = 0;
      for (int AA=-1; AA<10000-CC; ++AA) {
        Q = Q + V[AA+1] - H[10000-CC-AA];
        ans >?= Q;
      }
    }

    cout<<"Case #"<<t<<": "<<ans<<endl;
  }
  return 0;
}
Analysis — B. Ping Pong Balls
Special Cases
The small dataset can be solved by a brute force. With algorithms like breadth first search (BFS), one can find all the points that are triggered.
Another case we can use BFS is when the two displacement vectors are collinear. In this case all the points we need to consider are in a line, and there will be no more than 1000000 points on any line.
General Case
Interestingly, for the general case, where the two vectors are not collinear, one can use a shorter program with a simpler data structure. Here we introduce a solution that only involves vector additions. This is not the most efficient solution, but it is good enough for our purposes.
Note: This is not the first time we've encountered a 2-dimensional integer lattice where it is better to change the coordinate system. See the similar picture we have in the analysis for Problem D in online round 3.
Let us use [x, y] to denote the points in the ordinary coordinate system, and (a, b) to denote the points in the new system. Suppose the two displacement vectors are V1 = [δx1, δy1], V2 = [δx2, δy2], Suppose that the first ball hits position P = [x0, y0]. The points in the new system is given by
(a, b) := P + aV1 + bV2 = [x0 + aδx1 + bδx2, y0 + aδy1 + bδy2]. (*)
The problem is to figure out, from (0, 0), how many points will be hit by repeatedly adding (1, 0) or (0, 1).
It is not hard to prove, using (*) and the fact that the two vectors are not collinear, that for any points (a, b) inside the room, the numbers a and b are bounded by some quantity Q, where Q is the size of the room times the maximum value of the δs. With the limits in our problem, Q ≤ 2 × 10⁷.
For any fixed a, it is easy to see that there is a contiguous sequence of numbers b such that (a, b) is hit. In other words, there are numbers ba and b'a such that (a, b) is hit if and only if ba ≤ b ≤ b'a. This is because, if we let ba and b'a be the minimum and maximum b that get hit, respectively, then, by convexity, (a, b) is inside the room for all b between ba and b'a. Once we hit (a, ba), we keep adding (0, 1) and get all the other points. It is clear that (a, b'a) is the last point that stays in the room, and (a, b'a + 1) is outside the room.
It is good enough if we can iterate over a = 0, 1, 2, ..., (at most Q), and quickly compute ba and b'a for each a. Notice that, by definition, (a, ba - 1) is not hit. In order to hit (a, ba), the last step must be from (a - 1, ba). So
ba-1 ≤ ba ≤ b'a-1.
To find ba, we can simply start from ba-1 and keep increasing until we hit a point inside the room. Note that for a single a this might take a long time. However, the ba's are monotone, so the cost never exceeds Q.
Once we find ba, we can use a binary search to find b'a. Although a binary search is simple and quick enough, another approach seems dumber but actually works faster. Similarly to the way we get ba from ba-1, we may also get b'a from b'a-1. Here the b'a are not monotone, so we need to try both increasing and decreasing. Nevertheless, based on the rectangular shape of the room, the direction will not change more than once. The total cost is still O(Q).
Sample code from the judges for the non-collinear case:
int T, W, H;
int x, y, dx1, dx2, dy1, dy2;

bool inside(int a, int b) {
  int xx = x + a*dx1 + b*dx2;
  int yy = y + a*dy1 + b*dy2;
  if(xx<0 || xx>=W) return false;
  if(yy<0 || yy>=H) return false;
  return true;
}

long long play() {
  long long ans=0;
  int b1=0; int b2=1000001;
  for(int a=0; ; a++) {
    while(!inside(a, b1)) {
      b1++;
      if(b1>b2) return ans;
    }
    if(inside(a, b2)) {
      while(inside(a, b2)) b2++;
      b2--;
    } else {
      while(!inside(a, b2)) b2--;
    }
    ans+=(b2-b1+1);
  }
  return 0;
}
Analysis — C. Mine Layer
For the convenience of discussion, we denote ci,j as the input number at the position (i,j), i.e., the number of mines in the 3 by 3 square centered at (i,j). In the solution below we will see that, any solvable square must have a unique answer for the number of mines in the middle row.
(1) The number of mines in any 3 rows and 3K columns
In the picture below, sum up the ci,j's of the starred positions.
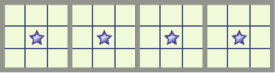
(2) The number of mines in any 3 rows and C columns
If C is not a multiple of 3, based on C mod 3, use one or two squares on the boundary.
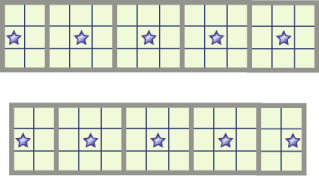
In summary, to get the number of mines in any three consecutive rows, we look at the middle row, start from either the first or second square, and mark every 3rd square. Let the middle row be the a-th row. We denote this sum by Fa.
Also note that with exactly the same method, F0 gives the number of mines in the first two rows, and FR-1 does the same for the last two rows.
(3) The number of mines in the whole board
Similarly, based on R mod 3, start from a = 0 or 1 and sum up the Fa for every 3rd number.
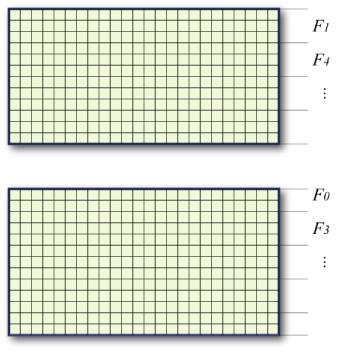
(4) The number of mines in the first 3K or 3K+2 rows
We omit the picture here. It is similar to the pictures above. We either group the first 2 rows together, or the first 3. By symmetry, we can also get the number of mines in the last 3K or 3K+2 rows.
(5) The number of mines in the middle row
Let h = (R - 1) / 2. There are h rows above the middle row, as well as h rows below.
If h mod 3 is 0 or 2, we can get the sum of those 2h rows from step (4) and subtract it from the total number of mines from step (3).
If h mod 3 is 1, we can get the sum of the first h+1 rows from step (4), as well as the sum of the last h+1 rows. Only the center row is counted twice, so we can subtract the sum by the total number of mines from step (3).
Solution from the judges
int T, R, C;
int c[100][100];

int SumRowsCentered(int a) { // F(a) as in the discussion.
  int r=0;
  for(int i=(C%3)?0:1; i<C; i+=3) r+=c[a][i];
  return r;
}

int play() {
  int i;
  // Get the total.
  int total=0;
  for(i=(R%3)?0:1; i<R; i+=3) total+=SumRowsCentered(i);
  // Get the answer.
  int h=(R-1)/2; int S=0;
  if (h%3==1) {
    for(i=h-1;i>=0;i-=3) S+=SumRowsCentered(i);
    for(i=h+1;i<R;i+=3) S+=SumRowsCentered(i);
    return S-total;
  } else {
    for(i=h-2;i>=0;i-=3) S+=SumRowsCentered(i);
    for(i=h+2;i<R;i+=3) S+=SumRowsCentered(i);
    return total-S;
  }
  return 0;
}

int main() {
  int i,j,k;
  cin>>T;
  for (i=1; i<=T; i++) {
    cin>>R>>C;
    for(j=0;j<R;j++) for (k=0;k<C;k++) cin>>c[j][k];
    cout<<"Case #"<<i<<": "<<play()<<endl;
  }
  return 0;
}
Analysis — D. Bridge Builders
This problem seems intimidating at first glance. There are many different routes between the islands and the costs are somewhat unintuitive. However, the problem is actually a disguised Minimum Spanning Tree between the forests; and the nice thing about MSTs is that they are very friendly to greedy approaches. Almost any reasonable greedy approach that focuses on connecting up the forests will get the right answer.
It is fairly easy to convince yourself that the correct approach to the Small dataset is to head directly for the other forest; it can't possibly hurt, since all the other islands pay their minimum possible cost (ie, the distance to the nearest forest). In fact, assuming that islands pay their minimum cost is key: you can ignore this "base" cost, and then the only time you actually have to pay "extra" is when connecting up the two forests.
So for the Large dataset, once again you ignore the "base" cost for each island and simply focus on reaching all the forests, at which point you're done. Based on this intuition, you might immediately think of building a MST across the forests. The "extra" cost of connecting forests increases with distance, so use Prim's Algorithm: always head towards the forest nearest to the forests you've already visited. After connecting all the forests, you can build minimal-cost bridges to the remaining islands.
This greedy approach always works, and is quite an intuitive answer when you think of the problem in these terms. However, the proof that it works turns out to be quite technical. The problem is that you have to be sure that the forest connections really do form a graph with well-defined, order-independent costs. If your choice of path between one pair of forests could somehow help you save cost later, this would be incorrect (and the specter of NP-Completeness would loom menacingly). It seems reasonable that this can't happen, especially if you try a few examples yourself. But writing a proof in contest time is probably impossible. In fact, it took us several days of collaboration to come up with a proper, correct proof. :) This is what you have to deal with as a competitor in the Finals of the Google Code Jam!
Here's an outline of this proof:
First, suppose that we already have a tree (no cycles) of bridges which connects up every island. We show that the cheapest way we could have built these bridges is given by our MST algorithm (where distances are measured along the given tree). Assume we have some cheapest ordering of the bridges. First, we can reorder at no cost to ensure that it consists of direct sequential paths from a previously-visited island to a forest. Now suppose there is ever an island A from which we build two bridges, A-B and A-C. Further, suppose A-B leads to a closer island than A-C, but we build A-C first. Finally, suppose this is the last such occasion; so we build directly to the closest islands in B's subtree and in C's subtree.
Let w be the distance, when A-C is built, from A to its nearest forest along built bridges. Let x be this distance when A-B is built (so x <= w). Let y be the distance from A to its closest island in B's subtree, and z to the closest island in C's subtree (so y <= z). Then the cost of building these A-C and A-B paths is (w+1 + w+2 + ... + w+z) + (x+1 + x+2 + ... + x+y). Instead, if we do the A-B path first and leave A-C and its subtree until later, we pay at most (w+1 + w+2 + ... + w+y) + (x+1 + x+2 + ... + x+z), and possibly less since intermediate steps may also cost less. The second subtracted from the first is (w+y+1)-(x+y+1) + (w+y+2)-(x+y+2) + ... + (w+z)-(x+z) = (z-y)*(w-x), which is non-negative.
Thus, without increasing the cost, we can rearrange the order of bridges to build A-B first. Repeating this, we determine that one cheapest way to build the tree of bridges is always to head for the nearest forest first, which is what our algorithm does.
Now, for any graph (a set of islands with a set of possible bridges), we prove inductively that our algorithm always gives the cheapest cost. It's true for 1 island; assume it's true for k. Suppose we have a minimal plan to connect up k+1 islands. Let A-B be the final bridge built. B could not have been visited already; so consider this plan restricted to the first k islands. Inductively, we know this plan is no cheaper than our algorithm, when run on those k islands; furthermore -- a nice fact about our algorithm, if you have not noticed yet -- after running our algorithm A is as close as possible to a forest. So doing this then building A-B is also a cheapest plan, and, importantly, this forms a tree of bridges. Let's call it T.
Now, from above, we know the cost of building this tree of bridges: it's just the total cost based on running our algorithm on the forest-to-forest distances in T. But these distances are at least as large as the corresponding forest-to-forest distances along all the potential bridges between our k+1 islands. We've paid at least as much as a normal spanning tree on our forests - so at least as much as a MST. But our algorithm achieves this MST cost, which we now know to be minimal.
QED.
Interestingly, this result also holds for any graph of islands and potential bridges, not just a grid or a planar graph. And the distance-to-cost metric can be any nondecreasing function. These facets of the problem are artificial and not essential to the algorithm.
Finally, here is pseudocode for the solution, assuming you know any standard MST algorithm.
for each unordered pair of forests (a, b)
  x = distance(a, b)
  y = x / 2  // Assume integer division
  c = x * (x + 1) / 2  // Add cost of connecting forests
  c -= y * (y + 1)  // Subtract "base" cost of islands
  if x is even
    c += y // Avoid double-counting middle island
  add edge (a, b) at cost c to forest_graph

result = min_cost_spanning_tree(forest_graph)

for each island x
  d = INFINITY
  for each forest y
    d = min(d, distance(x, y))
  result += d  // Add "base" cost of island x
Analysis — E. The Year of Code Jam
The different appearances of perimeter
In spite of the nice story about the calendar and the fancy definition of happiness, we hope that you have discovered the following abstract description of this problem.
On a board of N by M unit squares, some squares are blue, some are white, and some are undecided. For each undecided square, color it either blue or white, so that the total perimeter of blue region is maximized.
We see that the perimeter can be defined in two ways.
- (a) The sum of the contributions from each blue square, as indicated in our problem statement.
- (b) The sum of the contributions from each unit segment. Count 1 for each unit segment that separates two squares with different colors. (Assume all the squares outside the board are white.)
The second interpretation is useful for the following analysis.
There are some simple observations that seem useful. For example, for any undecided unit square, if we have already decided that two of its neighbors are blue, then in one optimal solution we can assign it to be white. Yet, as far as we know, no such heuristics give a complete and fast solution to our problem.
A similar problem
Let us discuss a problem that at least looks similar to ours. What if we wanted to minimize the perimeter instead of maximizing it?
We rephrase the problem in terms graph theory. Let the set of NM unit squares be our vertices, and let there be an edge between two adjacent squares. Our task is to color each undecided vertex either blue or white, so that the number of edges (in the graph) between the blue vertices and the white vertices is minimized.
This is rather nice, isn't it? If you add a source s and a destination t, add one edge from s to every blue vertex with infinite capacity (4 is enough) and one edge from every white vertex to t with infinite capacity, then the problem is asking for a minimum cut from s to t, which can be solved by your favorite max flow algorithm.
Solving the original problem
While minimum cut is polynomial-time solvable by max flow, the max-cut problem is too hard in general graphs. Therefore, our problem still seems much harder than the minimization version of the problem.
However, we have not used an important fact yet. Our graph is far from arbitrary. We play this game on the N by M board; the resulting graph is bipartite (imagine it as a chessboard). Maximizing the number of edges between different colored vertices is the same as minimizing the number of edges between vertices of the same color. In other words, if we flip the colors of one half of the chessboard, the problem reduces to the minimization version we discussed above.
We mark the board in a chessboard fashion, label the unit squares as odd or even. Then we flip the color of all the even squares. Now look at property (b). A contribution becomes a non-contribution and vice versa. The total number of edges is fixed, so the maximization problem reduces to its minimization version.